Graph 1: Primary Energy per Capita
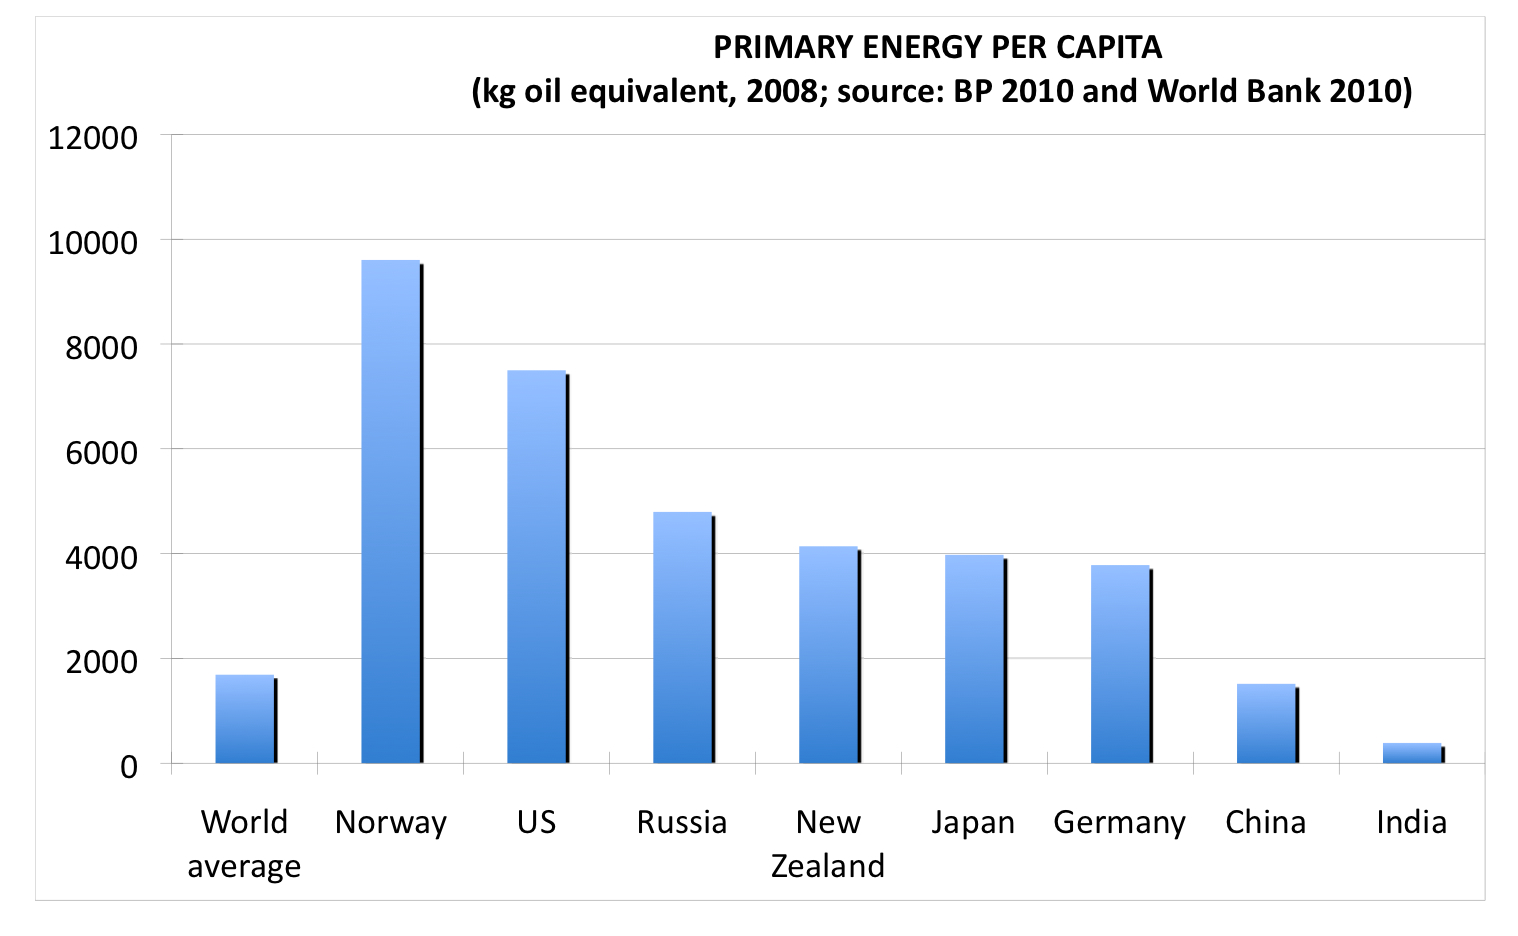
Note where India is on the graph. This is primarily due to their relatively small industrial base and extremely large population (the same reason that China, even with massive amounts of energy use, is small as well. Between the two of them they have somewhere between twenty-five and thirty-five percent of the global population). The next graph follows from this one and shows roughly what you'd expect.
Graph 2: Per Capita CO2 Emissions

As I said, this shows roughly what you'd expect. India has the smallest per capita energy use of the countries shown and thus has the smallest per capita CO2 emissions. As a side note, Norway drops off the graph because, while they use an enormous amount of energy, something like 90% of their electricity comes from hydro power, which for all its other environmental problems, is an extremely clean source of energy from a CO2 emissions standpoint.
The final graph is the kicker and what really caught my attention in class. It shows the per kilowatt hour emission of CO2. Basically how efficiently, from an emissions standpoint, you produce your electricity. As I've already said, Norway does this extremely efficiently.
The final graph is the kicker and what really caught my attention in class. It shows the per kilowatt hour emission of CO2. Basically how efficiently, from an emissions standpoint, you produce your electricity. As I've already said, Norway does this extremely efficiently.
Graph 3: CO2 Emissions per kW of Electricity

It should be obvious now that India does not produce electricity efficiently in terms of emissions. Nor does China (this most people knew already and is due to the massive number of coal power plants they are building). It's worth noting that Brazil, who also gets huge amounts of its electricity from hydro, is so low on the list and Norway isn't even on the list.
So what does it all mean? A lot of economists think that in the next 30 years India will overtake China as the fastest growing economy due to demographic reasons (China's population, due to the one child policy, has peaked and will start to decline. India, on the other hand, is still growing). Right now India's per capita emissions are so low because it's per capita energy use is so low, which is due to the fact that most of the population still lives an agrarian lifestyle. As Dani Rodrik points out here, as countries develop labor moves from agriculture to industry. Industry requires significant increases of energy inputs over pre-modern agriculture. A lot of this energy comes in the form of electricity (factory lights, urban street lights, factory machines, etc). Thus, as India's population urbanizes and industrializes their per capita use of energy, and therefore per capita emissions, will increase. What the third graph says is that for every unit increase in energy usage, their emissions will increase more than anywhere else in the world. So the least efficient country in the world in terms of emissions from electricity will also be the fastest growing country in the world. A wonderful combination.
Big picture? It means that global CO2 emissions will increase even faster as India industrializes than they did while China was industrializing. A terrifying thought for anyone who is concerned about atmospheric concentrations of CO2. It also underlines the absolute necessity of getting developing countries on board with any climate agreement. I'm not sure about the scale impacts of India's emissions relative to the developed world but it isn't inconceivable that their development could negate any unilateral efforts to reduce emissions undertaken by the developed world.
So what does it all mean? A lot of economists think that in the next 30 years India will overtake China as the fastest growing economy due to demographic reasons (China's population, due to the one child policy, has peaked and will start to decline. India, on the other hand, is still growing). Right now India's per capita emissions are so low because it's per capita energy use is so low, which is due to the fact that most of the population still lives an agrarian lifestyle. As Dani Rodrik points out here, as countries develop labor moves from agriculture to industry. Industry requires significant increases of energy inputs over pre-modern agriculture. A lot of this energy comes in the form of electricity (factory lights, urban street lights, factory machines, etc). Thus, as India's population urbanizes and industrializes their per capita use of energy, and therefore per capita emissions, will increase. What the third graph says is that for every unit increase in energy usage, their emissions will increase more than anywhere else in the world. So the least efficient country in the world in terms of emissions from electricity will also be the fastest growing country in the world. A wonderful combination.
Big picture? It means that global CO2 emissions will increase even faster as India industrializes than they did while China was industrializing. A terrifying thought for anyone who is concerned about atmospheric concentrations of CO2. It also underlines the absolute necessity of getting developing countries on board with any climate agreement. I'm not sure about the scale impacts of India's emissions relative to the developed world but it isn't inconceivable that their development could negate any unilateral efforts to reduce emissions undertaken by the developed world.

